

This year has been full of surprises. Apple threw the cat amongst the pigeons with their iOS 14 update. Facebook threw its toys out of the pram. And then, not to be outdone, Google joined the party and said they were removing third party tracking by the end of the year (and then backtracked not long after). A lot has happened, and we’re only halfway through 2021.
It’s been a tumultuous time in adland post-COVID, and digital marketers have had to adapt quickly. The landscape of reporting and attribution has undergone a considerable change, which needs to be conveyed to clients in one way or another – especially when presenting year-on-year (YoY) reporting and insights between 2020 and 2021.
The two critical areas of consideration are:
- Explaining the YoY comparisons and the full extent of the impact the pandemic had on performance
- Explaining the changes in reporting and attribution that have come into effect since then, and how results this year aren’t going to be a like-for-like comparison to last year (at least when looking in-platform)
2020 vs 2021
Our goal as digital marketers is to ensure clients see consistent growth while managing expectations, keeping both client and agency comfortable with the strategy, forecasts and trajectory of campaigns.
2020 threw a spanner in the works as a massive influx of consumers moved from retail, high-street shopping to online shopping in the wake of the national lockdowns last year. This naturally resulted in considerable increases in website traffic, transactions, revenue and return on ad spend (ROAS) during those months when people weren’t able to get to stores. It was a reality no one could’ve forecast for or factored in, but it led to many businesses flourishing during a period of enormous uncertainty.
Moving into 2021, COVID isn’t as much of an unknown, and lockdowns aren’t as expected (I’m looking at you, Delta variant!). Hence, consumers and businesses are aware of the personal and economic impact that COVID can have. As a result, we’re seeing website traffic and revenue returning to pre-pandemic levels.
Luckily for us, most e-tailers and businesses are aware that we aren’t comparing apples with apples when looking at 2020 vs 2021 performance, and we don’t have an unknown pandemic influencing consumer behaviour this time. It definitely still pays to compare YoY as you might be a business that’s continued to flourish through this time and are exceeding those 2020 highs. But if not, then you expand your comparison to look at performance data from 2019 to establish if you’re still trending in an upwards trajectory.
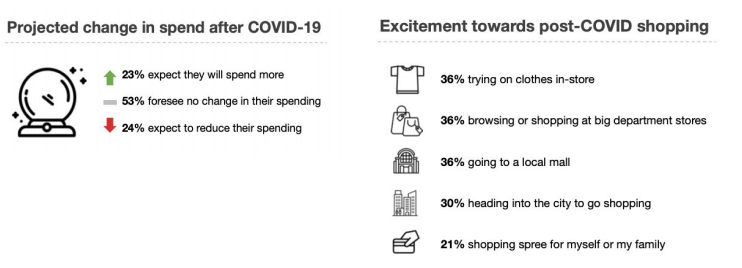
Similarly, this most recent lockdown feels different to the 2020 lockdown. Consumers aren’t behaving in quite the same way as they did in 2020, which is confirmed by insights from Google that highlight the excitement of Australians to return to in-store shopping. As such, it’s to be expected there will be a decline in online retail when comparing YoY data.
Changes to Attribution
Second, the comparisons between 2020 and 2021 are the changes to attribution and reporting in recent months.
There’s an added layer of complexity when it comes to reporting on performance across multiple platforms. This is because each platform’s reporting and insights are based only on what it sees from within its own pixel. Individual platforms (e.g. Google Ads, Facebook, Pinterest, etc.) all use their own third party pixel to report and optimise activity because it allows their algorithms to use historical performance data and machine learning to find high-intent audiences at a set budget to drive the maximum result for against a specific objective. The downside, however, is that siloed data distorts your view of the customer journey and leads to overreporting because it doesn’t consider the entire cross-channel customer journey.
That’s why it’s critical to understand how each platform reports and identify a single source of truth most suited to you.
The Danger of In-Platform Reporting
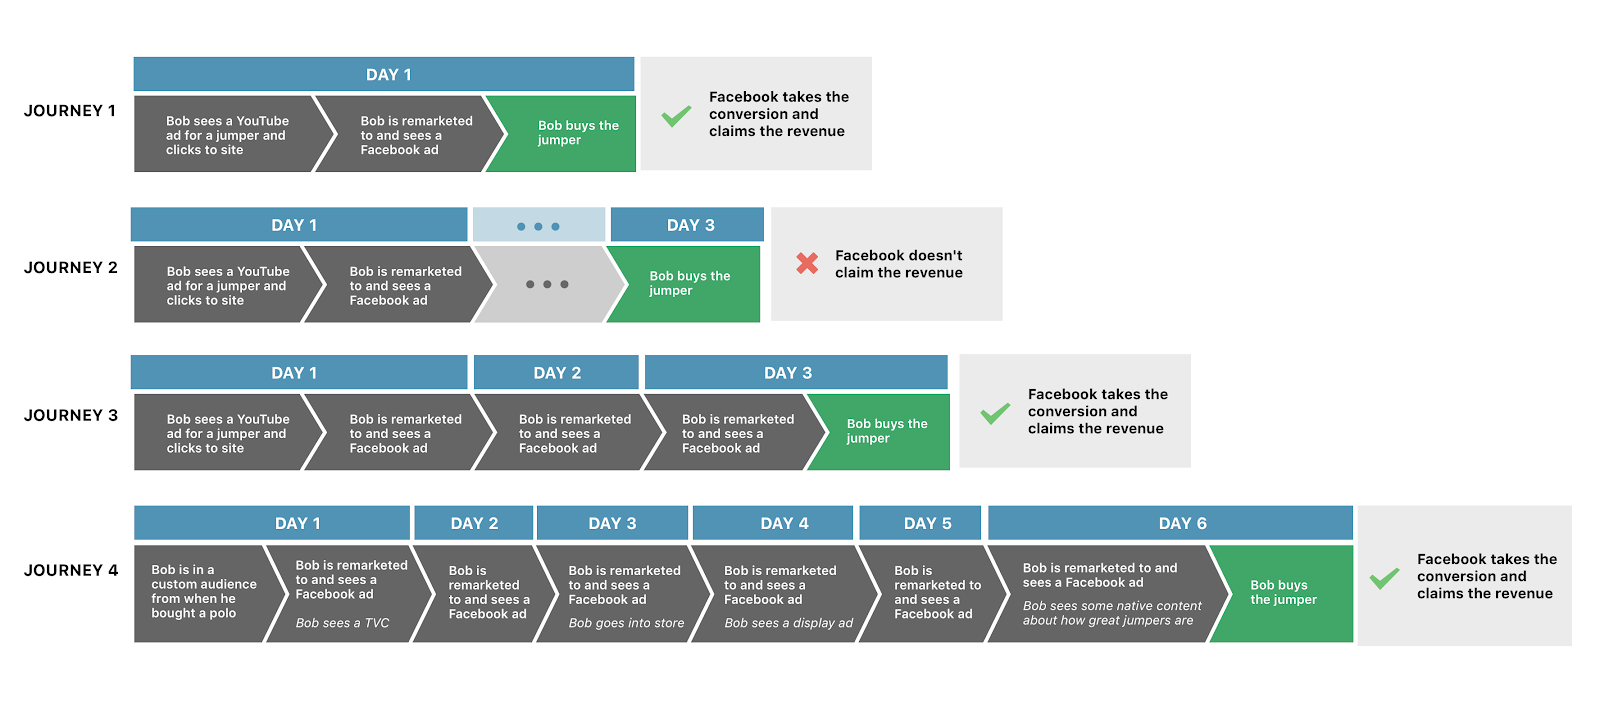
The danger with setting targets based on in-platform reporting – especially if you have remarketing activity live – is you end up optimising toward customers who had a high likelihood of converting regardless of seeing your ad or not.
The other key caveat to remember with third party tags is that because the tags can only see activity within a single environment, you cannot compare conversion activity from one third party tag to another. For example, you cannot compare Google Ads conversion volumes against Facebook or Facebook against Pinterest. If you do, you will end up double (or triple) counting conversions as multiple platforms may try and “claim” that conversion as its own.
Platform Reporting vs Google Analytics
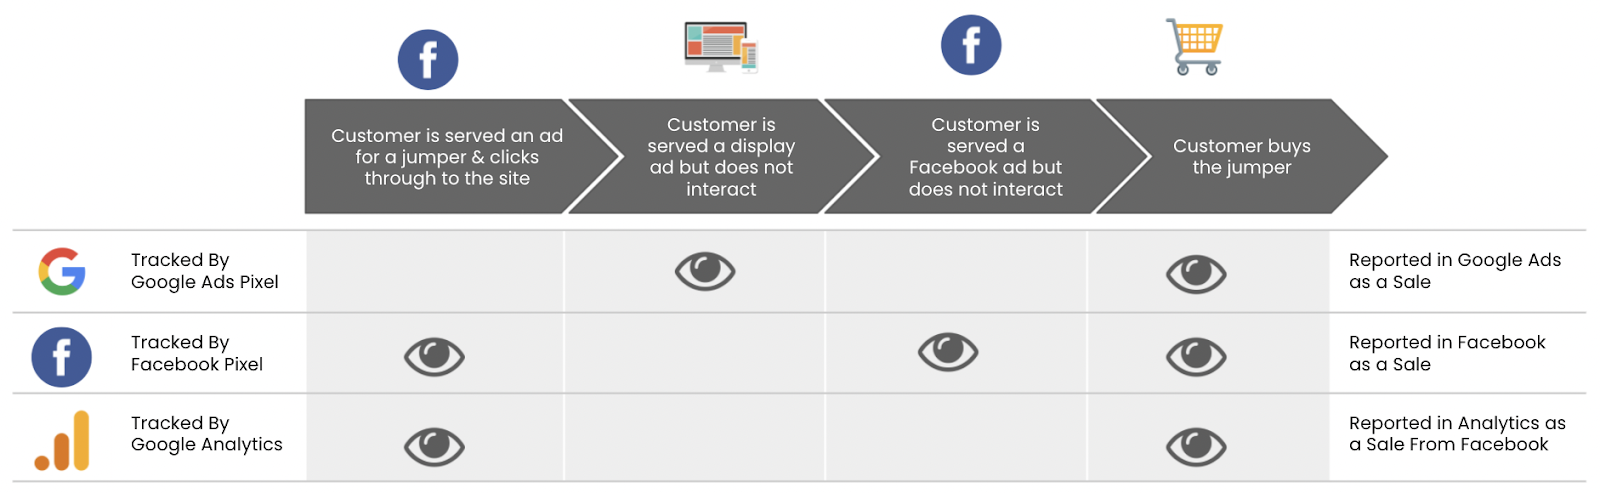
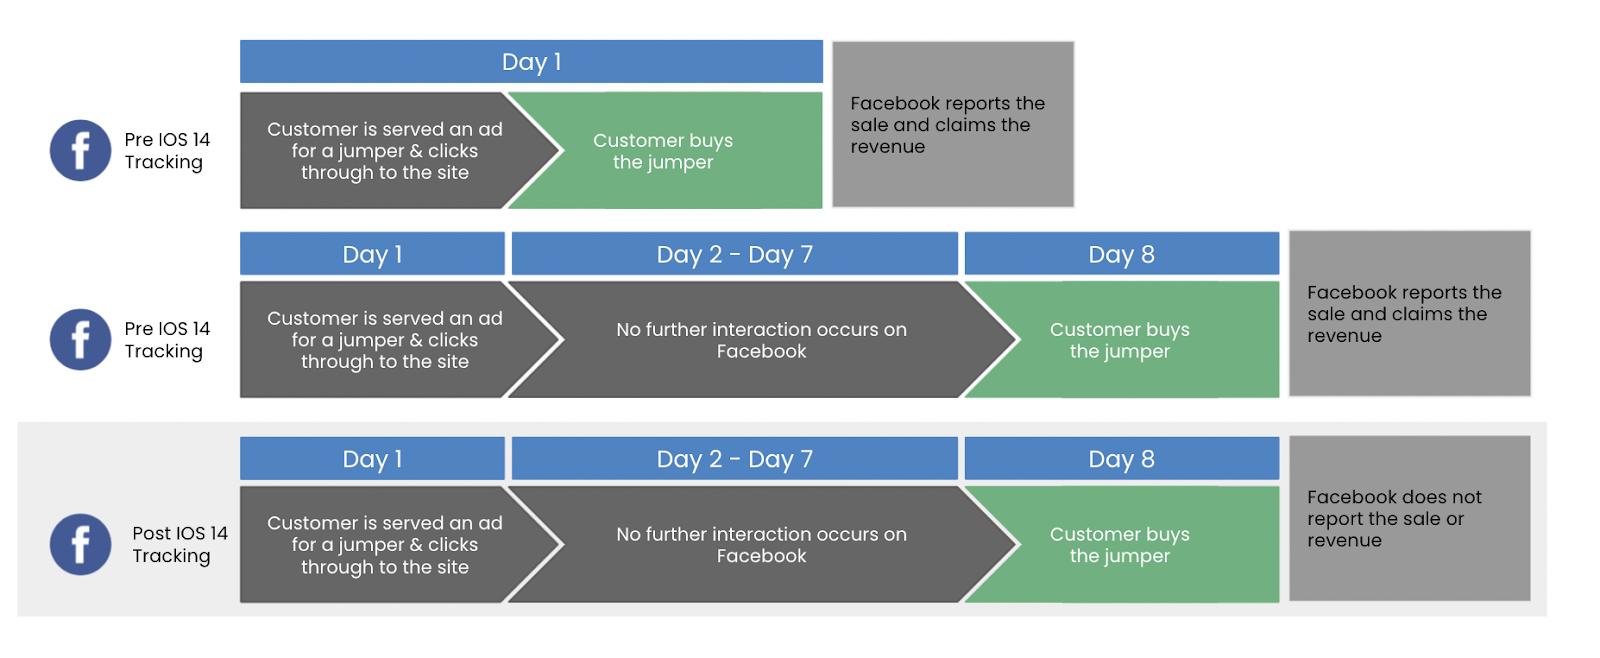
A key difference of in-platform reporting is that it allows for impression tracking, which in turn means you can trackback to a post-impression conversion (or view-through conversion). This means that if someone has seen your ad – but not taken any direct action to interact with the ad and click through to the site – and they then convert, you can still track that conversion back to your activity. As analytics platforms like Google Analytics can only track activity once someone lands on the site, these give a more well-rounded view of the effectiveness of your ads. The diagram below shows an example of this process:
Using a Single Source of Truth
Whilst not perfect, the benefit of using Google Analytics as a single source of truth for reporting is ensuring you don’t double-count any activity. That’s how the team at Yoghurt knows the actual impact of the strategies we’re putting in place to drive overall conversions, rather than the skewed and embellished versions the in-platform reports provide.
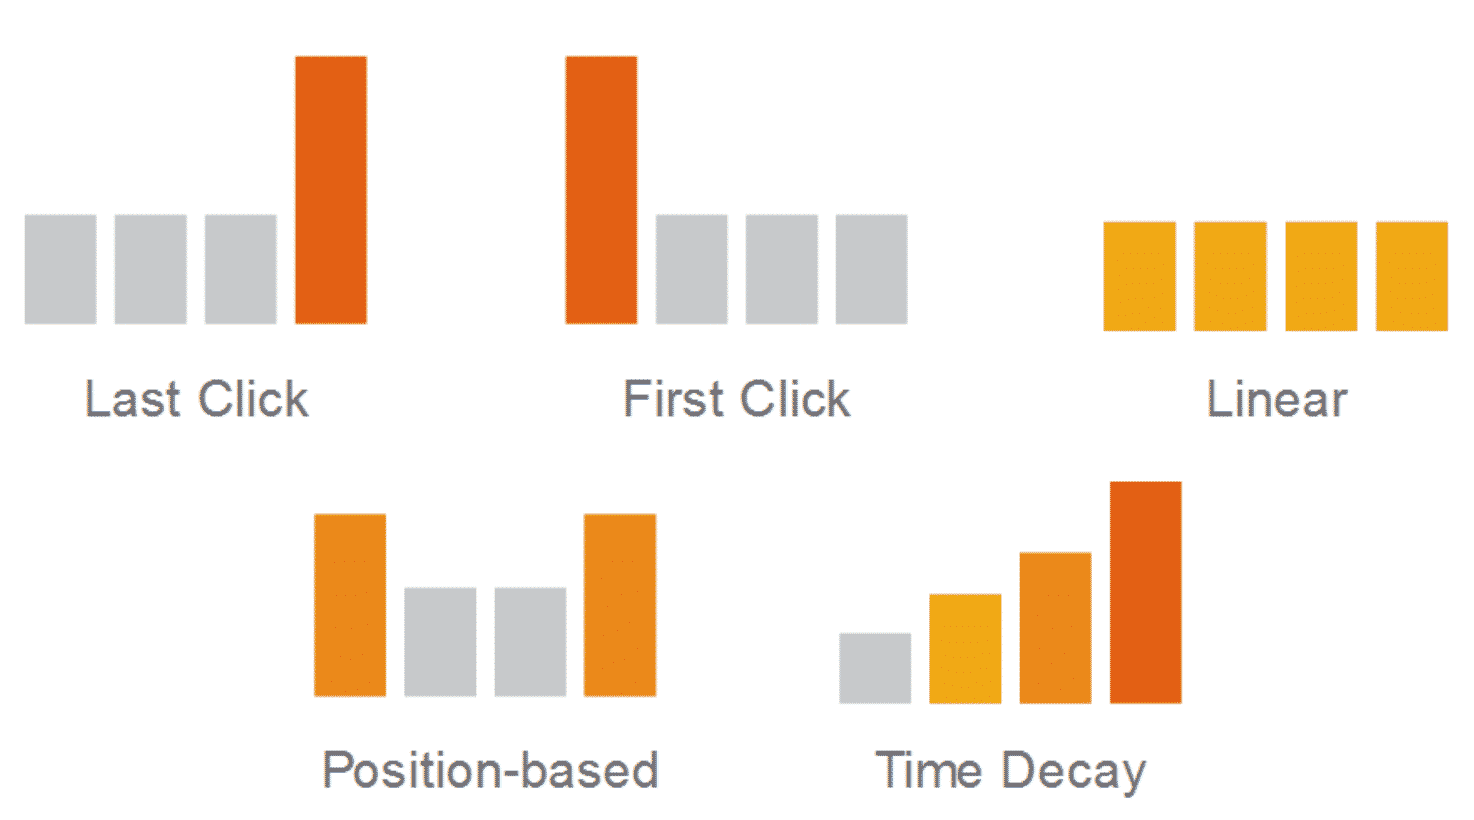
Within the platform, you can also view the roles of channels against different attribution models – not just last-click (however, please note it’s still unable to attribute back to impression-based activity).
Regarding the drawbacks of Google Analytics, it uses last-click attribution by default and skews towards bottom-of-funnel channels such as branded search.
The other option to get a complete picture of the role of each channel is to track through an ad server. This allows you to track all activities (including impression-based media) through a single platform and tag. If you would like more information on these platforms, please contact the team at Yoghurt today, and we’ll be happy to help. But it’s worth knowing that to track in this way does incur additional platform costs in the form of ad serving, click tracking and impression tracking fees.
The Impact of iOS14 on Reporting
With the rollout of iOS 14, Facebook will no longer default to a 28-day click, 1-day view attribution model and will now report on a 7-day click window. As a result of the decreased attribution window, Facebook performance metrics will see a decline.
There is a lot to get across, and it can be confusing. Ultimately, it’s the agency’s job to performance manage the campaigns to make sure they’re still driving increased bottom-line revenue, despite the metrics in the platform not reporting at the levels they once did.
If attribution is boggling your mind – which would be completely understandable – then please reach out, and let’s have a chat! We’re here as a resource to answer your questions, provide guidance, and implement solutions.