
Only two truths exist in the world of digital marketing:
- The consumer is always right.
They know what they want, and if you don’t deliver it they’ll simply go elsewhere - Data doesn’t lie.
Understanding what your potential customers actually want is far better than understanding what you think they want.
Therefore, it stands to reason that to successfully improve the design, usability and functionality of a website, you must learn what consumers want and make changes accordingly – supply and demand. And continuing that thought pattern, it would also stand to reason that the vast majority of companies who are refreshing or optimising their website are investing in data to drive their decision-making processes.
Right?
Painfully wrong.
Part 1: Data, Not Opinions
Most companies who approach us for assistance with optimising their website give us fairly standard reasons about what spurred them into action:
- “Our site is old and outdated, so we need a refresh.”
- “Our enquiries / revenue have been stagnant, and we should be doing more.”
- “Our competitor is doing X, Y and Z, and we don’t want to get left behind.”
- “I want 17 flashing banners on the homepage to showcase our best products.”
With the exception of the last one, those are all technically valid reasons. But not one of them starts with “Our consumers told us…” or “The data showed us…”.
Every company knows what they like and need internally, but have almost no idea what their consumers like and need. Yet time and time again we see companies use opinions and “gut feel” to make critical decisions that could exponentially accelerate or obliterate their online performance.
This article details part of our process and aims to provide better insight into what’s involved and how to go about improving website performance using science vs. guesswork.
Part 2: Types of Tracking
We’re a data-heavy agency and as such don’t make any decisions without consulting the numbers first. When it comes to improving website design and UX, there are various tools and processes we follow to help improve the performance of a website – whether it be engagement metrics such as time on site, or conversion metrics like enquiries and sales.
Besides the usual server logs and various analytics softwares, there are several tools and analysis methods marketers can utilise (we mainly reference Hotjar in this article) to better understand user frustrations and how we can reduce or remove their friction points.
Heat Maps
Heatmaps are visual representations of user interactions on web pages. They allow us to better understand what users are doing and how they interact with a website by visually representing their clicks, screen taps, movement and scrolling behaviour.
Click Maps
As a specific area of a page receives more clicks, the colour on the heat map changes. The brighter the area, the more popular it is; the darker the area, the less popular it is.
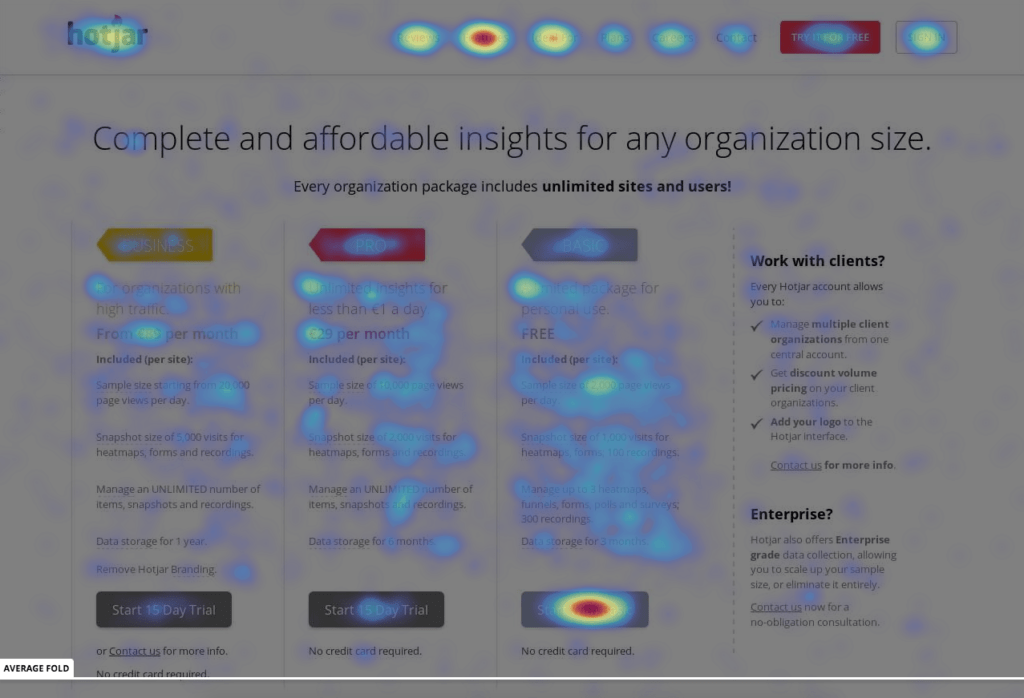
A click map example.
Scroll Maps
Scroll maps allow us to see how far down the page users scroll. Knowing this can help determine the ideal visual hierarchy for the page, including key content placements.
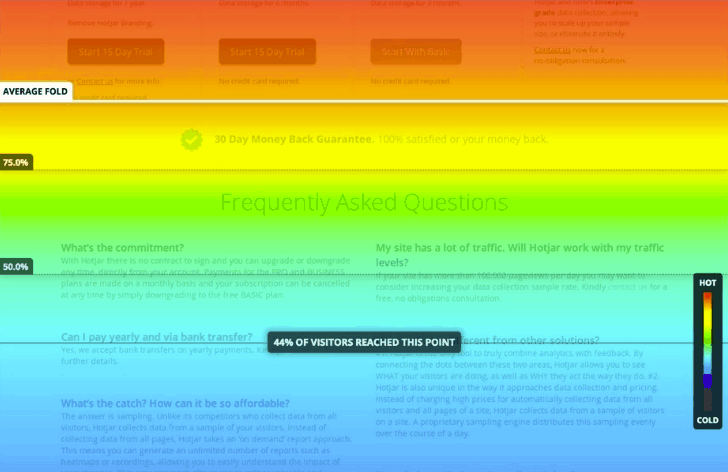
Oh look, a rainbow! Just kidding – it’s a scroll map.
Mouseflow
Similar to a click map, we’re able to record and analyse mouse movement which gives us extra insight into how users are digesting information on the page. We can see where they focus, what they ignore, and what gets missed completely.
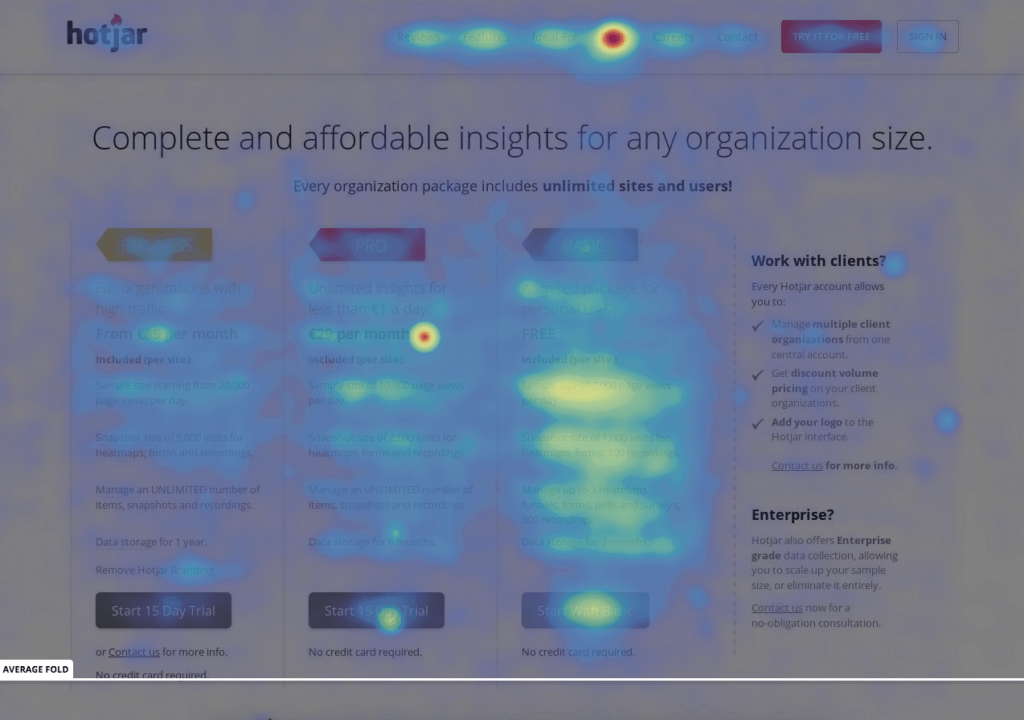
A mouseflow example.
Session Recordings
Session recordings allow us to view users anonymously as they browse the website. Essentially, it’s a screencast that follows all of their movements while they’re on your website. This allows us to isolate any potential friction points during their experience, uncover usability and functionality issues and analyse how they flow through the website.
Obviously watching every single video isn’t a reasonable expectation – especially if you’re getting tens or hundreds of thousands of visits per month. To optimise our time, we use Google Analytics and the various heat maps to identify pages that have potential issues and watch the session recordings for these pages. We’ll also watch sessions on major conversion pages – such as enquiry forms and checkout pages – where users typically struggle the most. These observations are then combined with the various heat map data to draw conclusions on potential optimisations to these pages.
Part 3: Processes
Now that we’ve described the various collection methods, lets talk about the process overall.
- Setup
- Data Collection
- Analysis
- Planning
- Implementation
- Measure
- Rinse & Repeat
Step 1 – Setup
We start the process by setting up relevant tools on the website and appropriate web pages. This involves adding JavaScript snippets (a piece of code) in the head of the HTML pages we want to track. While it’s possible to do this through something like Google Tag Manager, we don’t recommend it as it can cause bugs in the tracking and skew the data.
Next, we need to configure the tools to ensure they’re collecting the data that we need. We start by determining the pages that need to be tracked and then update the system to accommodate. We select the most critical pages on the website and track each of them across various device types (desktop, tablet, mobile). Typically, we would track:
- Home page
- Several of the major category pages
- Several of the major product / services pages
- Conversion pages (e.g. pages with enquiry forms, cart pages, checkout pages)
- Any other pages critical to the business and its goals
We use Google Analytics data to determine which pages have the most views and are most important in the conversion funnel, allowing us to collect data faster and in relation to relevant pages.
Step 2 – Data Collection
Tools like Hotjar and Crazy Egg seamlessly run in the background for as long as we need them to. In order for the sample size of data to be deemed statistically significant, we need around 2,000 sessions recorded on each page we’re tracking. This can be trickier for pages that are deeper in the conversion funnel (e.g. checkout page), but be patient. It’s important to base your decisions on accurate data, not just any data.
Step 3 – Analysis
Once the data has been collected, we need to analyse each map and session recording in detail to determine where and how the user’s experience can be improved. To do this, we:
- Study Google Analytics data (this is another blog post in itself)
- Review the heat maps
- Review the scroll maps
- Review the mouseflow maps
- Watch session recordings
Step 4 – Planning
After the analysis is completed, our outcome is a list of action items stored in an implementation plan that determines what changes should be made to the website in order to improve the user experience and, therefore, conversions.
The types of action items are sorted by difficulty vs potential impact and split into two categories:
Immediate Implementation
These are action items derived from our analysis that should be implemented immediately, without testing. They’re usually smaller changes that are causing clear issues in the conversion process.
Test & Learn
These are usually bigger changes that would noticeably affect a user’s path-to-conversion. In these instances we prefer to build hypotheses and test them, allowing us to prove performance before investing in implementing it on the live site.
Before making major changes to any page, we use a scientific method:
- Make an observation
(Example: the ‘contact us’ button is too small and users can’t see it.) - Form a question
(Example: what would happen if the button was bigger?) - Form a hypothesis
(Example: bigger buttons are easier for users to see and interact with, which would lead to an increase in conversion rate.) - Conduct an experiment
(Example: show 50% of users the current button and show the other 50% of users the new button) - Analyse the data and draw a conclusion
Step 5 – Implementation
Once the plan is created and the recommendations approved, we start working with the client’s web development team to start making changes – both directly and via multivariate testing.
We use tools like Optimizely and Visual Website Optimizer to develop designs for testing, splitting the traffic equally between our variation and the control.
Step 6 – Measure
Measurement is only possible if you’ve properly defined the performance metrics for the test. Are you looking at engagement metrics? Conversion metrics? Behavioural metrics? Once these are defined, you can accurately track how each metric performs across the control and the variation.
We run our tests for at least two full weeks until we reach a level of statistical confidence (over 95%), at which point we can call a winner. If a level of statistical confidence isn’t reached, we take the learnings from the test and tweak it to measure the impact.
Step 7 – Rinse & Repeat
It’s important to remember that this is an iterative process. It’s not done once and then pushed to the side. The point of this is to do it constantly and consistently. Big wins can be had in this initial process, as you’re at the very start of your journey and should have a long list of items to implement and test.
It’s also worth noting that higher engagement rates and conversion rates have a DIRECT correlation with organic search performance and, as such, the two go hand-in-hand when it comes to online success.
Part 4: Conclusion
As this wonderful comic illustrates, having personal opinions thrown into the design and usability conversations during a website refresh project can wreak utter havoc. And while it’s hard not to revert back to what you think is right, it’s important to remember that your end goal is to deliver an improved experience for existing and prospective customers alike.
Others may find it hard not to take it personally when you shoot them down, but as long as you keep pointing to the data to back you up, they don’t have much of a leg to stand on. Always remember: don’t just copy others, because then you’re always one step behind. Listen to the voice of your customers, deliver what they want, and lead from the front.
All images courtesy of Hotjar.